Kamino: Solana’s Credit Router

Thesis:
Kamino looks undervalued for what it does today: it routes Solana deposits into real borrow at scale (utilization ~61%, fees/TVL ~4%, ~29% share of chain TVL) yet trades on revenue multiples closer to middling venues; we stay constructive while that operating mix holds and step aside if it doesn’t.
TL;DR (for allocators)
- ◆What Kamino is: more a credit router than a “big lender.” Vault deposits become portable claims, those claims are accepted as K-Lend collateral, and guarded leverage turns them into borrow and fees. That design converts incentives into habits.
- ◆What the numbers say now: ~$3B TVL, ~$1.77B borrowed (≈61% util), fees/TVL ≈4%. Kamino captures about $41M of fees per $1B TVL, which is top-tier among peers.
- ◆Why the equity looks cheap: Mcap/revenue sits around 8× versus a peer cluster closer to ~30–60×; FDV/TVL is mid-pack (~0.21×). In plain English: better throughput per TVL, lower multiple on the revenue created.
- ◆Season 4 read: flows have been deposit-led with a short lag in borrows—fine if conversion/retention follows. The right success test is 7/14/30-day retention and whether deposit surges are matched by borrow days, not headline TVL.
- ◆Float context: July’s ~$13M unlock was absorbed with price steady near $0.06; another month-end unlock is coming. Vesting slows reward supply. We treat unlocks as a monitoring item, not the core thesis.
- ◆What would change our mind: multi-week slippage in any part of the “engine”—fees/TVL, utilization, or share—or evidence that Season 4 deposits don’t convert and stick.
Today’s snapshot (as of Aug 13, 2025)
- ◆TVL: ~$3.0B (Kamino) vs $10.4B (Solana DeFi) → ~29% share.
- ◆Borrowed: ~$1.77B → ~58% borrowed/TVL.
- ◆Fees & revenue:30d fees ~ $9.7M, 30d revenue ~ $1.6M; annualized fees ~$118M, revenue ~$19M.
- ◆Token:KMNO ~$0.053–0.054, mcap ~$134–136M (circulating ~2.52B, max 10B).
These are the fingerprints of a venue that monetizes volume without pure-subsidy scaffolding.
The three-number rule
What we measure — one number that can’t be faked for long.
We track Retained Throughput:
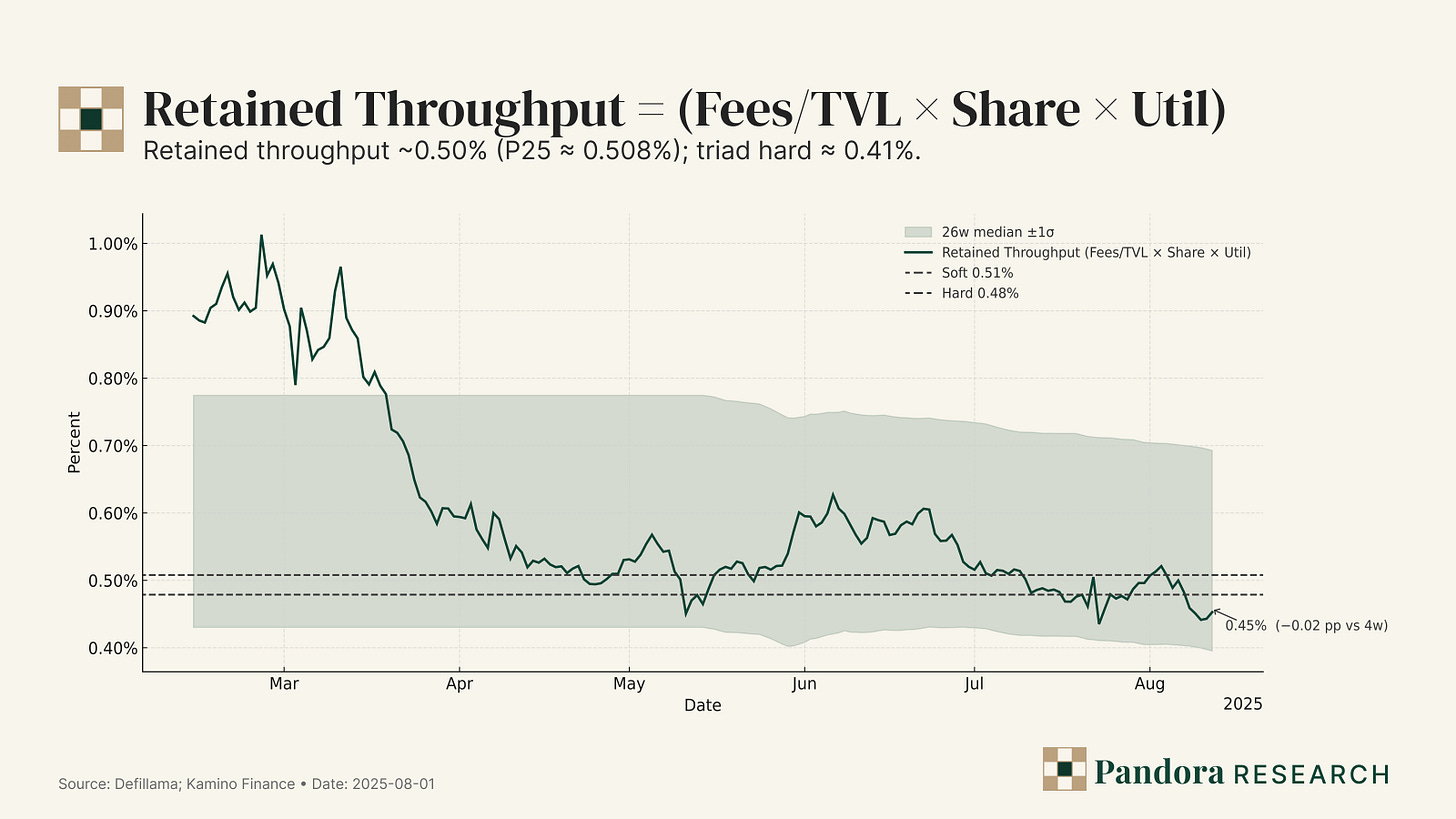
Retained Throughput ≈ (Fees ÷ TVL) × Share of Solana TVL × Borrow Utilization
This composite rises only when Kamino (i) monetizes real flow, (ii) holds chain share, and (iii) converts deposits to borrow. Any venue can goose one of these for a week; keeping all three strong for a month is hard.
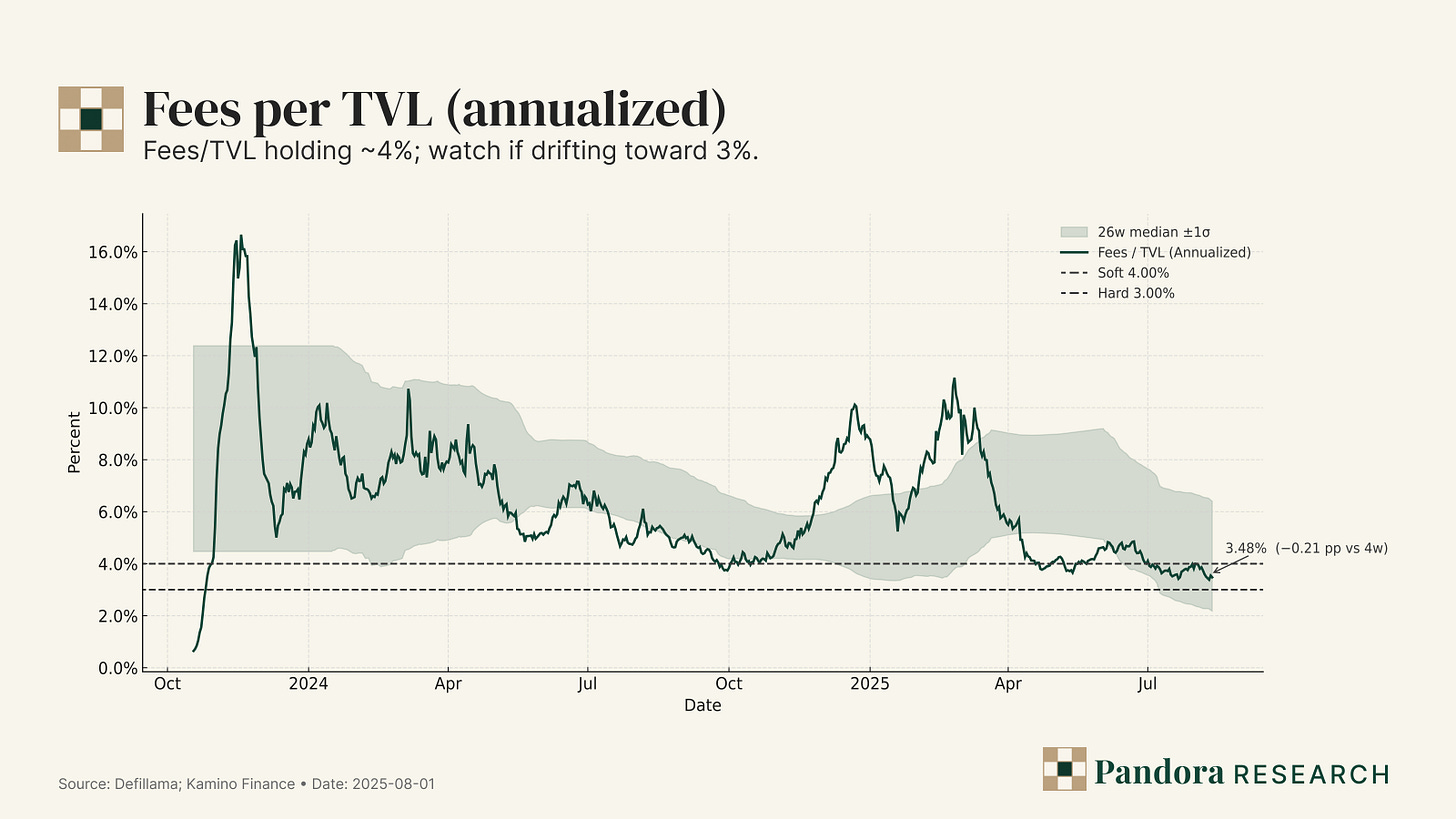
Fees ÷ TVL — are we paid for real demand?
Annualized fees/TVL is the venue’s monetization intensity. Near ~4% with stable take-rate implies spreads/depth clear organic flow, not emissions. A drift toward 3% for several weeks says either incentives did the lifting or pricing quality slipped. We smooth with a 4-week MA to avoid overreacting to unlocks/campaign cliffs.
– Soft/HARD gates:4% / 3%.
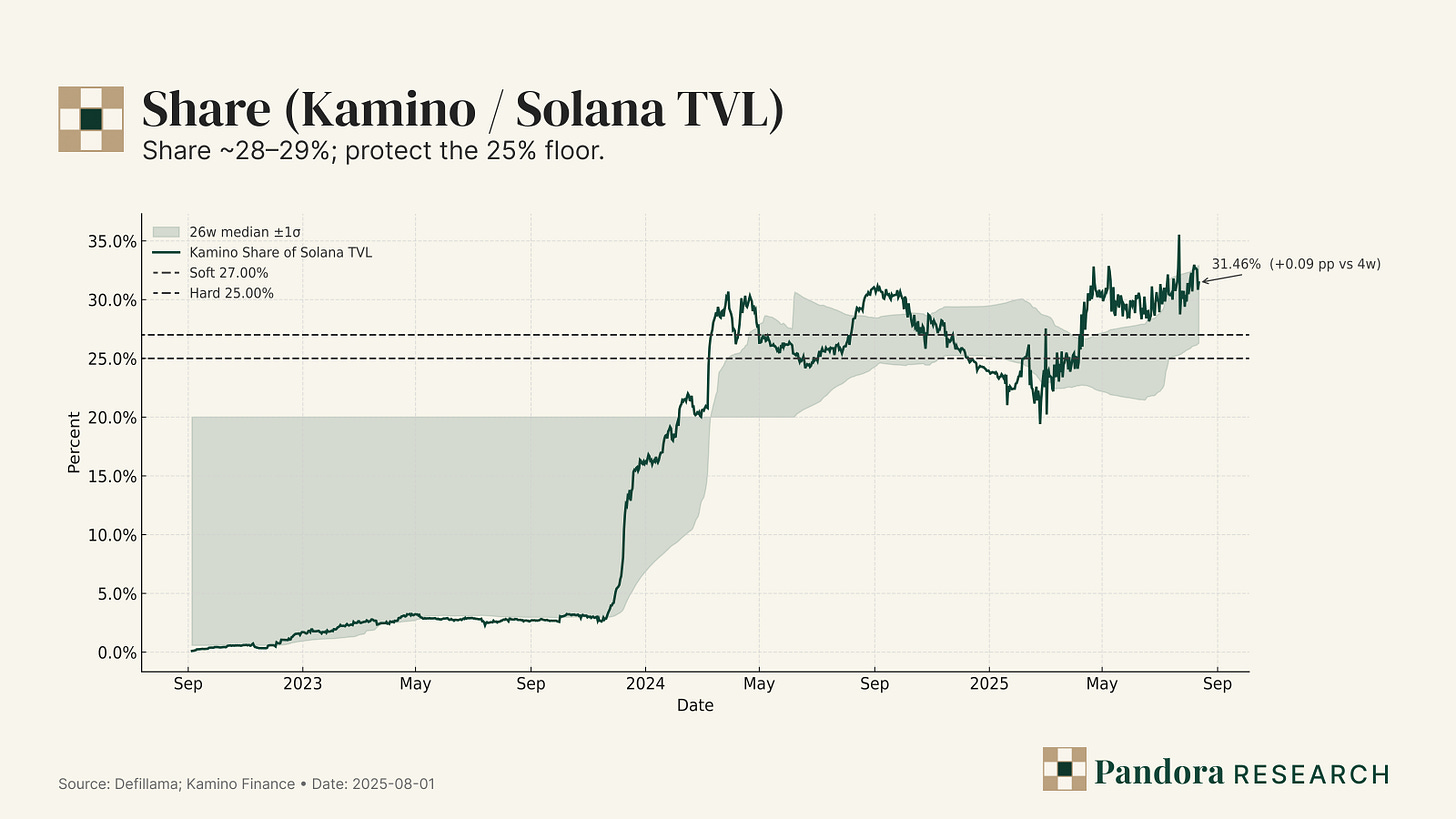
Share — Kamino’s ceiling is the chain.
Share = Kamino TVL ÷ Solana DeFi TVL. Chain beta lifts (or caps) absolute volumes; falling share means the router premise is weakening regardless of local optimizations. Small moves matter: +200–300 bps share, held, compounds throughput even if fees/TVL is flat.
– Soft/HARD gates:27% / 25%.
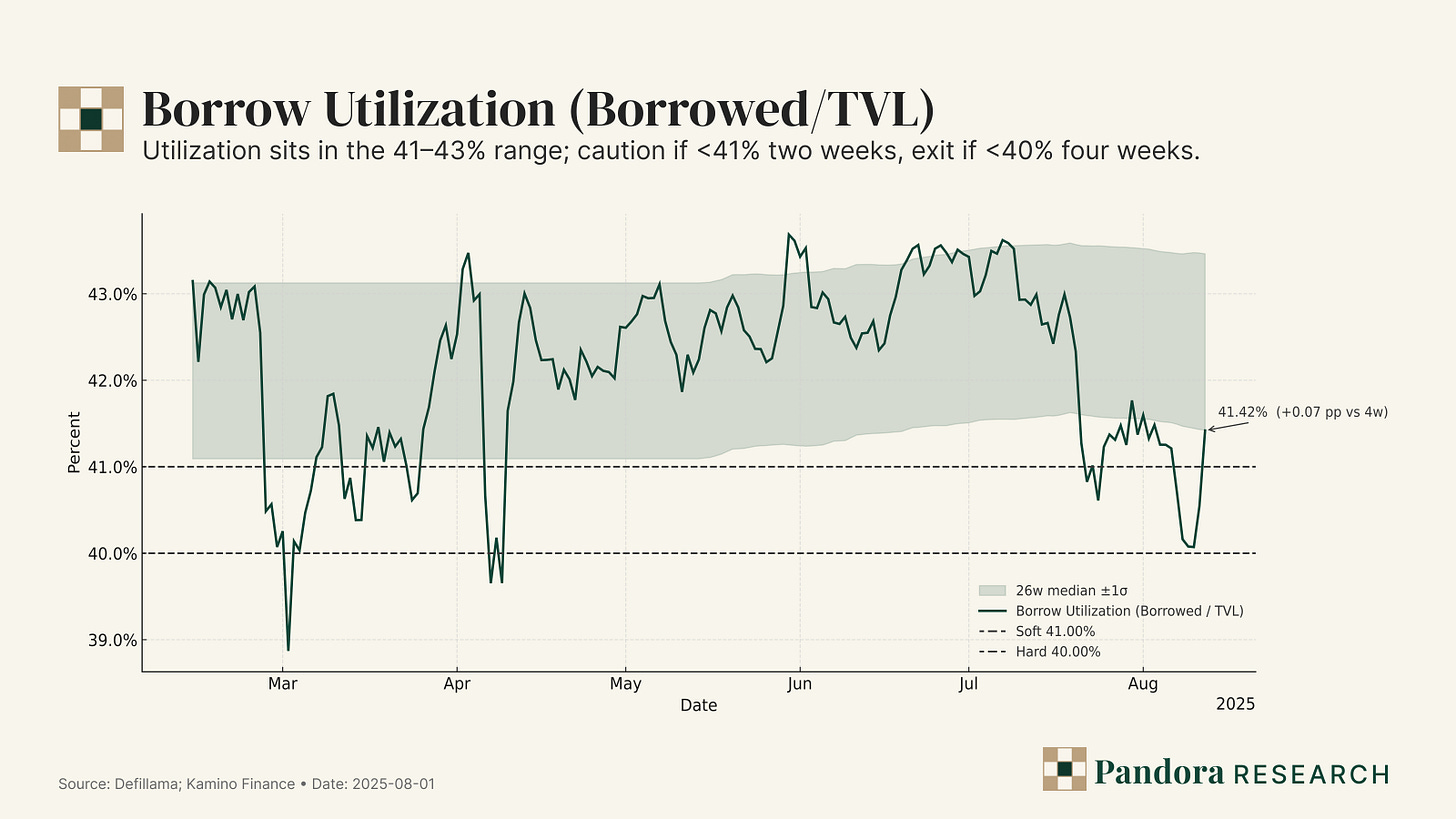
Borrow Utilization — no credit, no thesis.
Utilization = Borrowed ÷ TVL in K-Lend. This filters idle deposits. Our full-series analysis shows a 41–43% typical band; using that history, we set data-grounded floors: caution <41% for two weeks; exit if <40% for four (outside chain-wide shocks). If listings and distribution are converting, utilization won’t live below those bands.
– Soft/HARD gates:41% / 40%.
Why multiply them?
Because they’re mutually constraining.
- ◆High share without fees/TVL = scale with poor pricing.
- ◆High fees/TVL without utilization = noisy fees on thin bases.
- ◆High utilization without share = limited upside.
The product forces discipline: you can’t window-dress all three at once.
Decision rule (commitment device).
- ◆In: while fees/TVL ≈ 4%, share ≥ 25%, util ≥ 40–41% for 4 straight weeks, with liquidations inside normal bands.
- ◆Out / downsize: if any dial breaks its hard threshold for 4 weeks, or if 30-day post-campaign retention <60% in two cycles.
What the market is missing
Most coverage still frames Kamino as “a big Solana lender.” That lens misses the design choice that actually compounds value: Kamino is a credit router. Deposits start in automated vaults where users learn a simple habit—park collateral, earn native yield, forget the badge engineering. Those vault shares are portable claims, so value can move without forcing users to unwind. Kamino then ports the claims into K-Lend collateral, where a conservative risk engine gates assets by correlation and liquidity bands. From there, guard-railed leverage loops scale positions only where the math is favorable. The result is not vanity TVL that flees when rewards fade; it’s retained throughput—collateral that reliably feeds borrow demand and produces fees after the campaign banners are gone.
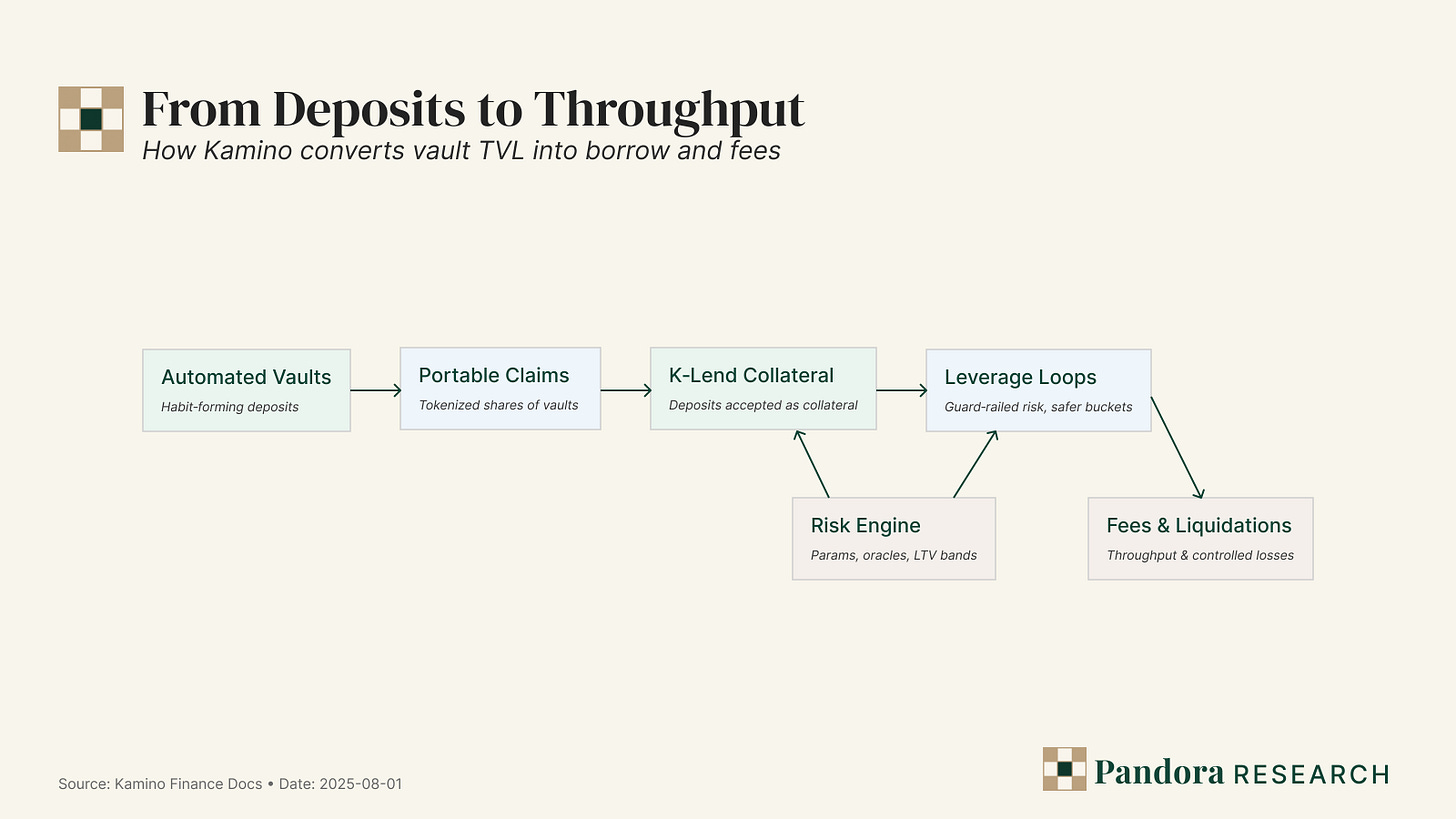
Two things make this architecture defensible.
First, frictionless routing: users can move from “deposit” to “collateral” to “borrow” without round-trips, slippage, or UI archaeology. That removes the most common choke-point where emissions-driven TVL usually dies.
Second, opinionated risk: correlated assets sit in explicit buckets (e.g., LST “eMode”), LTVs adjust to liquidity conditions, and liquidation bands are tuned to reduce wide-tail wipeouts. This is how Kamino converts incentives into habits; it’s also how it keeps borrow utilization respectable when the tape turns.
The demand side is widening in ways the market underweights:
- ◆LST corridors. Grouping staked-SOL variants into self-hedging buckets improves effective LTV without pretending correlation is zero. It also creates natural, repeat borrowers (LPs and basis traders) who roll debt rather than churning it.
- ◆BTCFi (zBTC/xBTC). Bitcoin-backed collateral recruits a borrower cohort that is not purely SOL-beta. That diversifies the cycle and sustains borrow when SOL-specific risk premia widen.
- ◆xStocks (tokenized equities). Collateral backed by enterprise pricing (Chainlink) and validated by low-latency oracles on Solana (Pyth/Switchboard elsewhere) opens a bridge to equity-style exposures. The point is not buzzwords; it’s new borrower profiles who don’t live and die on DeFi reflexivity.
Put differently: composition matters. TVL that converts to borrow within 4–8 weeks of a listing, and keeps liquidation prints inside normal bands, is worth more than TVL that spikes APY screenshots. Kamino’s stack is designed to favor the former. When vault deposits arrive via distribution (e.g., SwissBorg) they have a clear path to K-Lend, and the metrics that matter next are utilization and fees per unit of TVL—not headline inflows.
Listings → Borrow Conversion (4–8 weeks or it didn’t happen)
Claim.
A listing only “counts” if it becomes borrow within 4–8 weeks and keeps a majority of that borrow once incentives cool. We judge each market against four falsifiable gates, then roll results up by corridor (LST, BTCFi, xStocks, LP/Other) to decide Scale / Tune / Pause. This section is about retained throughput, not rented TVL.
The four gates (pair-level, falsifiable)
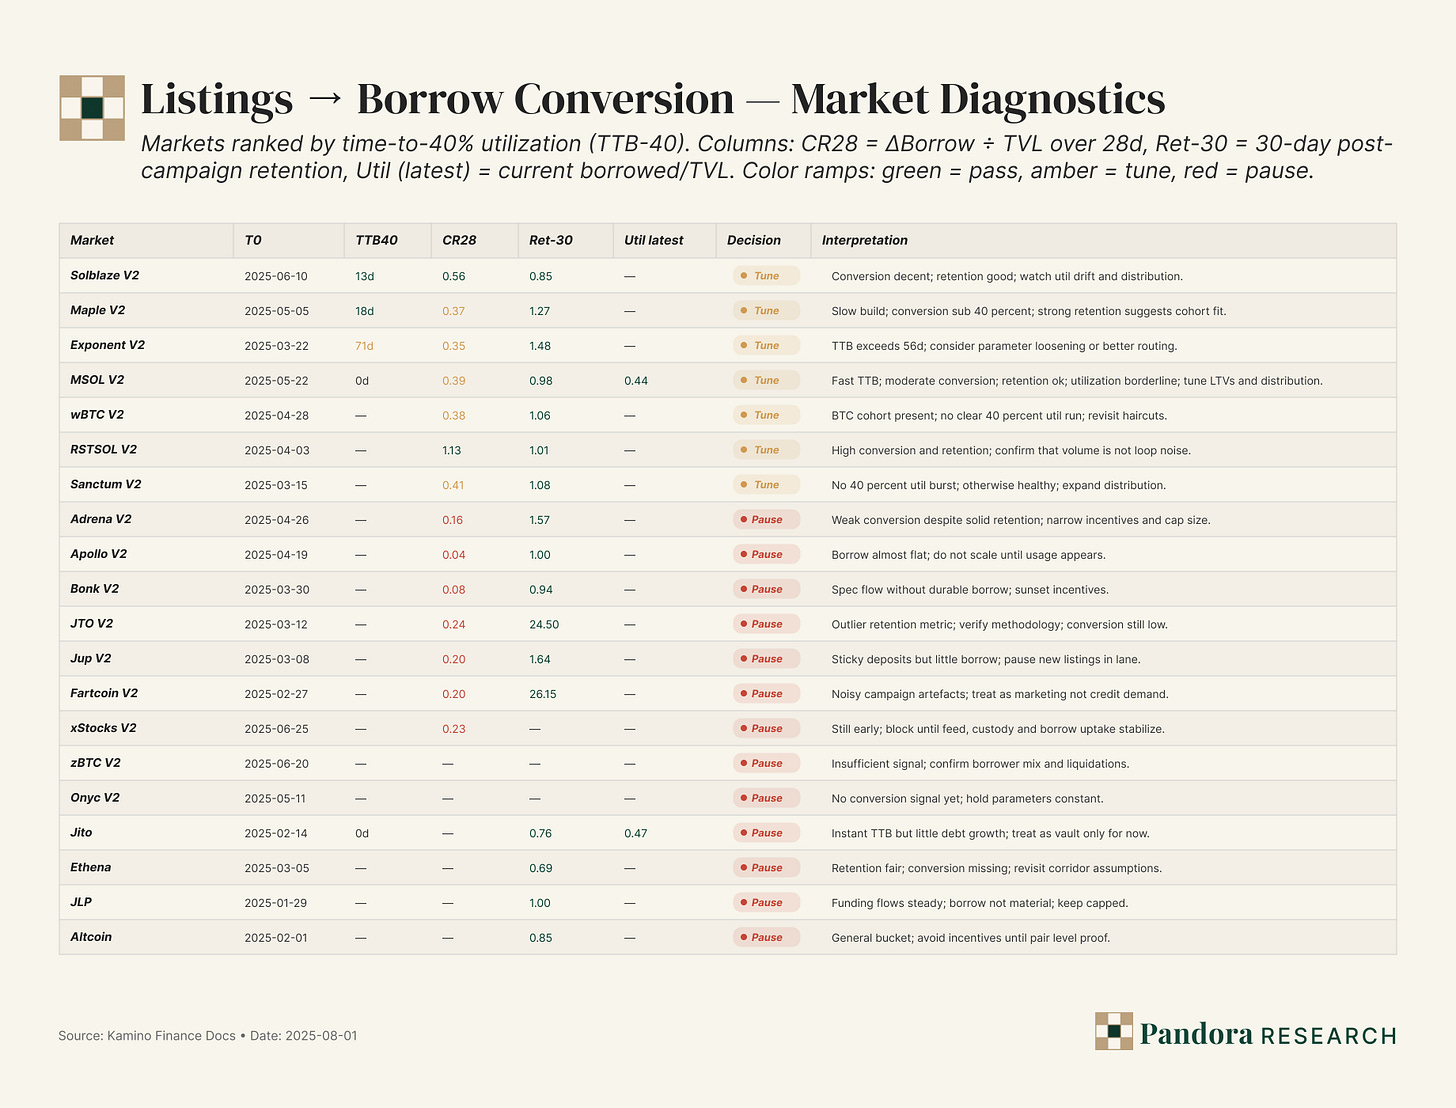
- ◆Conversion ratio (CR).
CR=ΔBorrow÷ΔDeposits from T₀ → T+14, T+28, T+56.
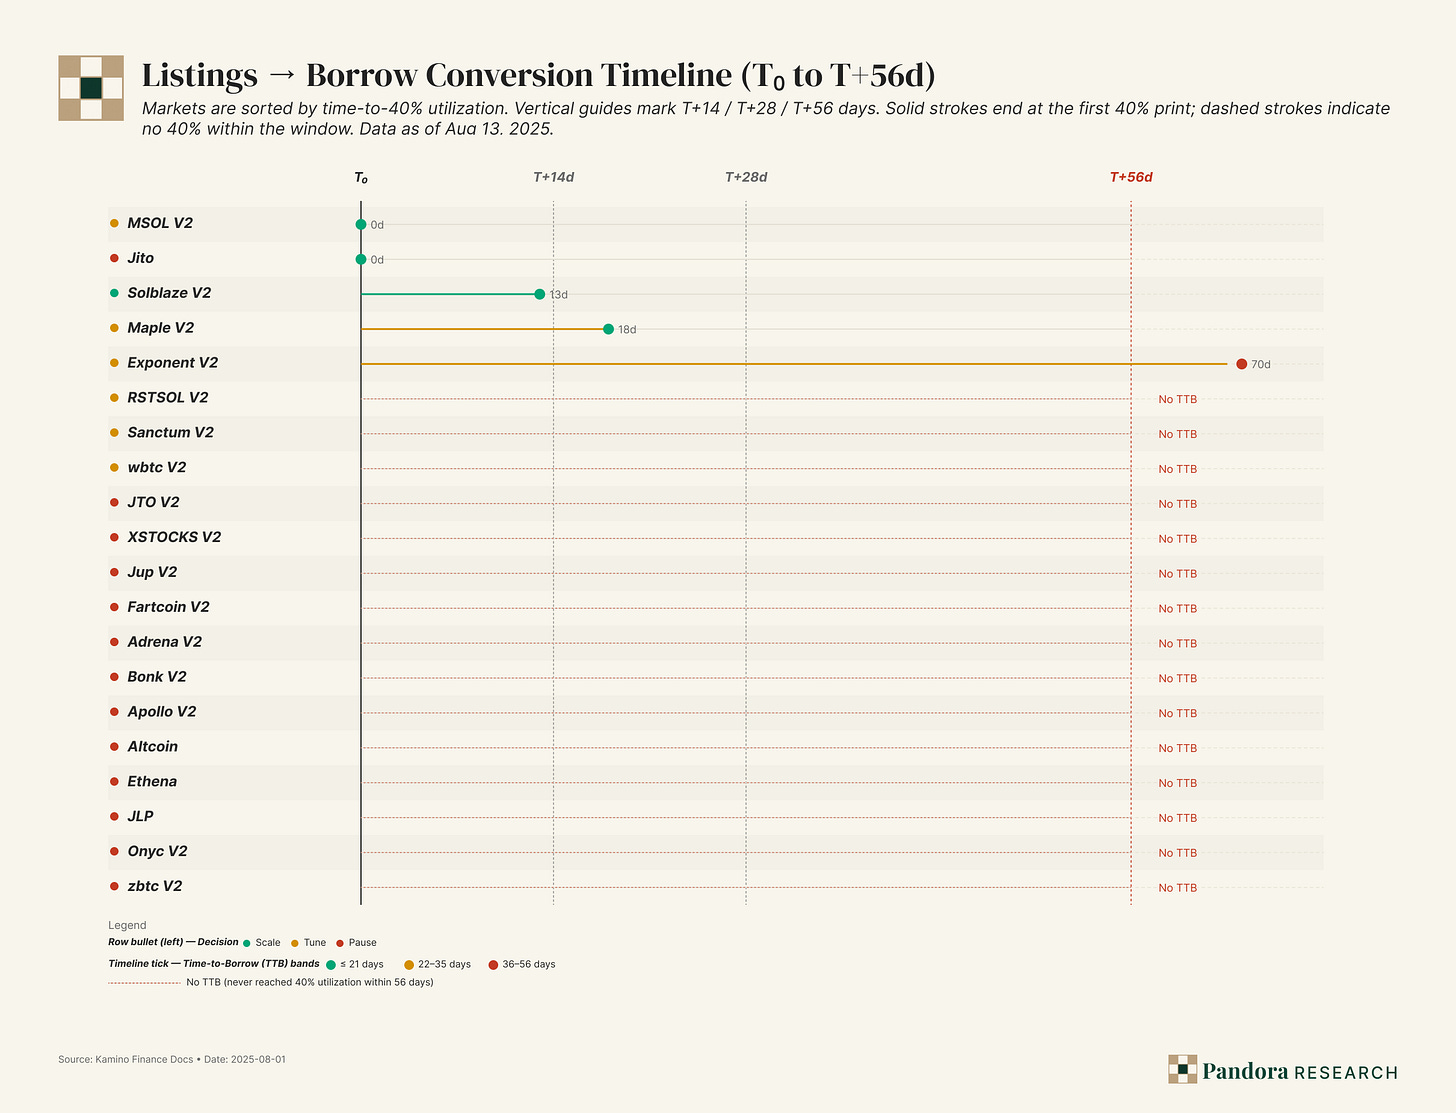
Strong: ≥ 0.50 by 4–8 weeks. Serviceable: 0.35–0.49 (likely needs parameter tuning/distribution). Weak: < 0.35 → rented TVL or friction (haircuts, oracle slippage, thin books). - ◆Time-to-Borrow (TTB-40).
Days from T₀ to ≥ 40% utilization (7-day MA). Green: ≤ 21d. Amber: 22–35d. Red: > 35d. Hard stop: if no 40% by T+56d, the lane hasn’t earned a slot on the router. - ◆30-day retention (Ret-30).
Borrow at T₀+30d ÷ borrow at T₀+14d (or the first-30-day peak). Healthy: ≥ 60%. Marginal: 40 – 60%. Weak: < 40% (incentive-driven or mismatched borrowers). - ◆Liquidation quality.
Liquidation count/notional versus the market’s historical band and corridor baseline. Repeated outliers → unsafe LTVs, fragile liquidity, or feed latency. We do not scale listings that “convert” by courting avoidable liquidations.
Instrumentation that keeps the math honest.
When a formal calendar is missing, T₀ is inferred from the first sustained deposit step after a quiet period. Utilization uses a 7-day MA. CR windows are fixed at 14/28/56 days. We tag chain shocks (2σ Solana weeks) and judge relative to matched cohorts to avoid blaming Kamino for chain-wide noise. A cannibalization check guards against borrow that’s just reshuffled from a sibling pair.
What the data says (Aug 10, 2025 cut)
Top-line reality check. Across 20 named/V2 markets we computed TTB-40, CR(14/28), and Ret-30. Among the markets that ever cross 40%, the median TTB ≈ 69 days—already outside our 56-day envelope—because several lanes never break the 40% bar in time. That is the point of the bar: protect budget, keep the router honest.
- ◆LST corridor → working (Scale).
- ◆Solblaze V2 and Sanctum V2 print solid 28-day conversion (CR ≈ 0.56 and 0.41 respectively) and trade like healthy eMode buckets.
- ◆RSTSOL V2 is an outlier in a good way (CR ≈ 1.13 on a smaller base)—a strong signal for safe LTV nudges (+2–3 pp) if liquidation bands stay quiet.
Verdict:Scale LSTs; push borrower-side incentives rather than deposit APR; review LTV bands with liquidation data in hand.
- ◆BTCFi & xStocks → early, under-converted (Tune).
- ◆zBTC V2 and xStocks V2 sit well below 40% utilization within eight weeks and show weak CR. That points to distribution gaps and/or conservative haircuts plus oracle hygiene concerns.
Verdict:Tune with three levers—(i) slight borrower APR uplift, (ii) haircut review where liquidations permit, (iii) feed drift alarms (≤20 bps for ≥60s) and fallback integrity checks.
- ◆zBTC V2 and xStocks V2 sit well below 40% utilization within eight weeks and show weak CR. That points to distribution gaps and/or conservative haircuts plus oracle hygiene concerns.
- ◆LP / Other → mixed; several lanes stall (Pause or Tune).
- ◆Maple V2 is workable (CR ≈ 0.37) and worth Tune—but needs clearer borrower routing.
- ◆Adrena V2, Apollo V2, BONK V2, Ethena, JTO V2, JUP V2, ONYC V2 do not reach 40% within eight weeks.
Verdict:Pause these lanes: de-incent, tighten LTVs, and require a borrower-side distribution plan before re-listing.
Decisions
- ◆Scale where TTB-40 ≤ 56dandCR-28 ≥ 0.35andRet-30 ≥ 60%, with liquidations inside bands. Incentives favor borrowers, not depositors; pricing and loop mechanics should reward credit demand over TVL optics.
- ◆Tune corridors with marginal prints: nudge borrower APRs, right-size haircuts, shore up oracle pipelines, and tighten risk buckets to reduce loop noise.
- ◆Pause lanes that miss TTB-40 or can’t keep Ret-30 ≥ 60%. Publish a short post-mortem (what we tried, what broke, what changes next) and set a date-stamped re-test before any new incentives.
Why this matters to KMNO
This discipline operationalizes the flywheel. Listings that convert inside eight weeks and retain ≥60% of early borrow lift fees/TVL and borrowed/TVL without subsidy—exactly what the market should pay a multiple for. Conversely, lanes that can’t hit 40% by T+56d or keep borrow post-campaign are rented TVL. The kill-switches here (Scale / Tune / Pause) keep the router focused on throughput that sticks, which is what ultimately defends the long in KMNO.
Incentives ≠ edge (Season 4 is a retention test)
Season 4 is designed to pull fresh capital into Kamino—but the part that compounds is what stays and turns into borrow, not the headline APY. The right way to read this season is through two lenses we already plotted: (1) who is supplying/borrowing across markets (retail vs institutional mix), and (2) how flows behaved day-by-day around launch. Together they tell us what’s signal, what’s noise, and where to push or pull incentives.
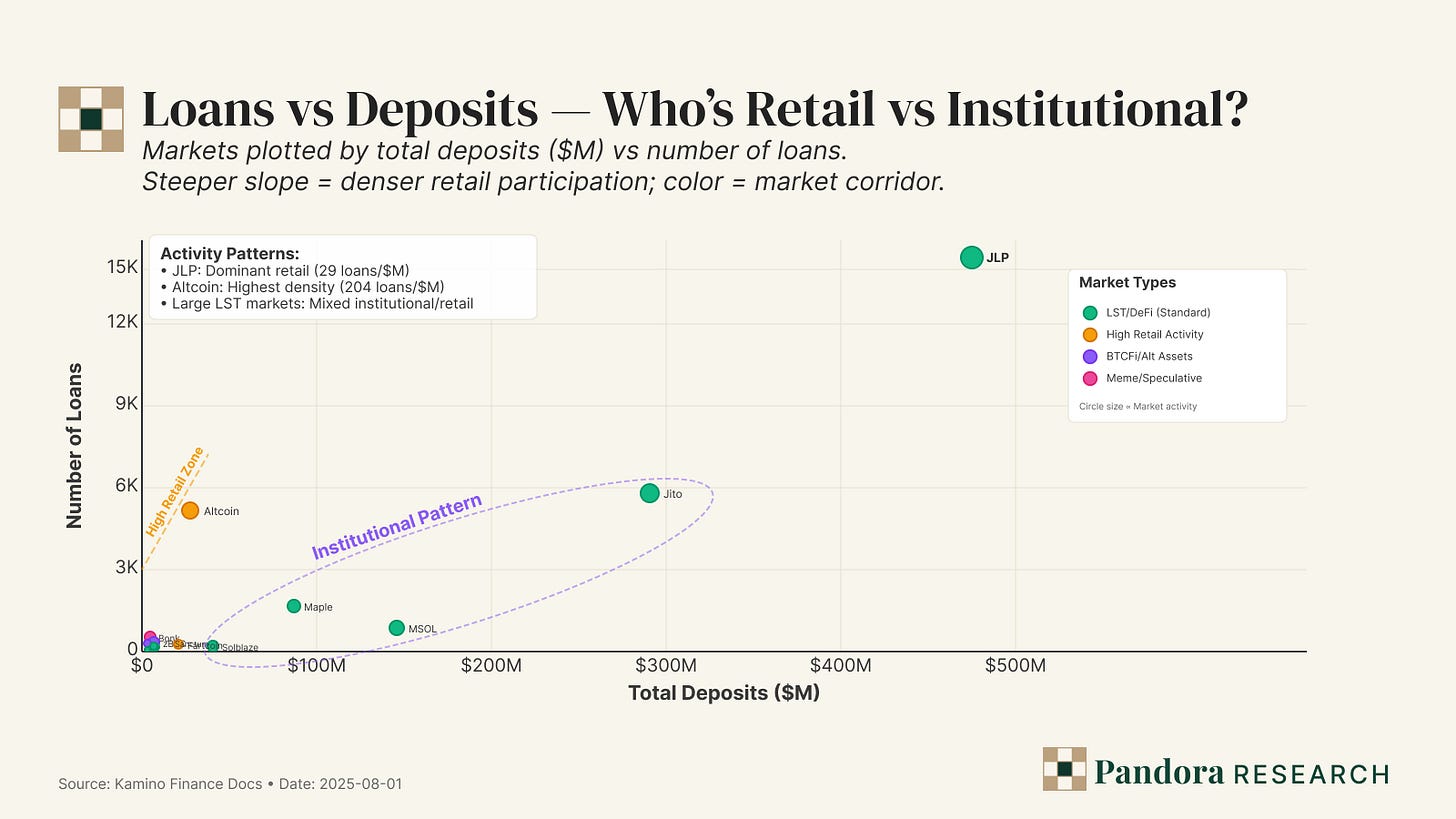
This scatter does one job: it shows loan count vs total deposits for each market, which is a simple but powerful proxy for user mix. Markets with many loans per $1M deposited skew retail (lots of small tickets); markets with few loans per $1M skew institutional (larger, slower-moving books). Three clear patterns jump out:
- ◆JLP is the hybrid giant. Large deposits and a very high loan count suggest it bridges retail and professional flow. That mix is what you want when you’re trying to convert deposits into durable borrow: enough breadth to keep utilization alive, enough depth to avoid fragile cascades on bad days.
- ◆Altcoin is retail-dense. Very small average ticket sizes push loan density off the chart. Retail density can be great for throughput (lots of small fees), but it’s fickle on retention—small tickets churn faster and are more sensitive to headline APYs and social flow.
- ◆The big LST lanes (Jito, mSOL, Solblaze) read as “institutional corridor.” Lower loan density fits desks that size deliberately, hedge systematically, and respond to parameter quality (LTVs, eMode, oracle hygiene). That’s the profile that sustains borrow after campaigns cool.
Why this matters for Season 4: incentives often over-credit deposit growth and undercount borrow conversion. The mix chart tells us where conversion is most likely to be sticky once rewards step down: LST lanes and JLP first, retail-dense “meme/spec” lanes only if they quickly demonstrate post-campaign stickiness. If we have to rank where a marginal incentive dollar should go, the scatter says: (1) LST corridor with good liquidation history; (2) JLP as the throughput anchor; (3) selective retail lanes only when retention proves out.
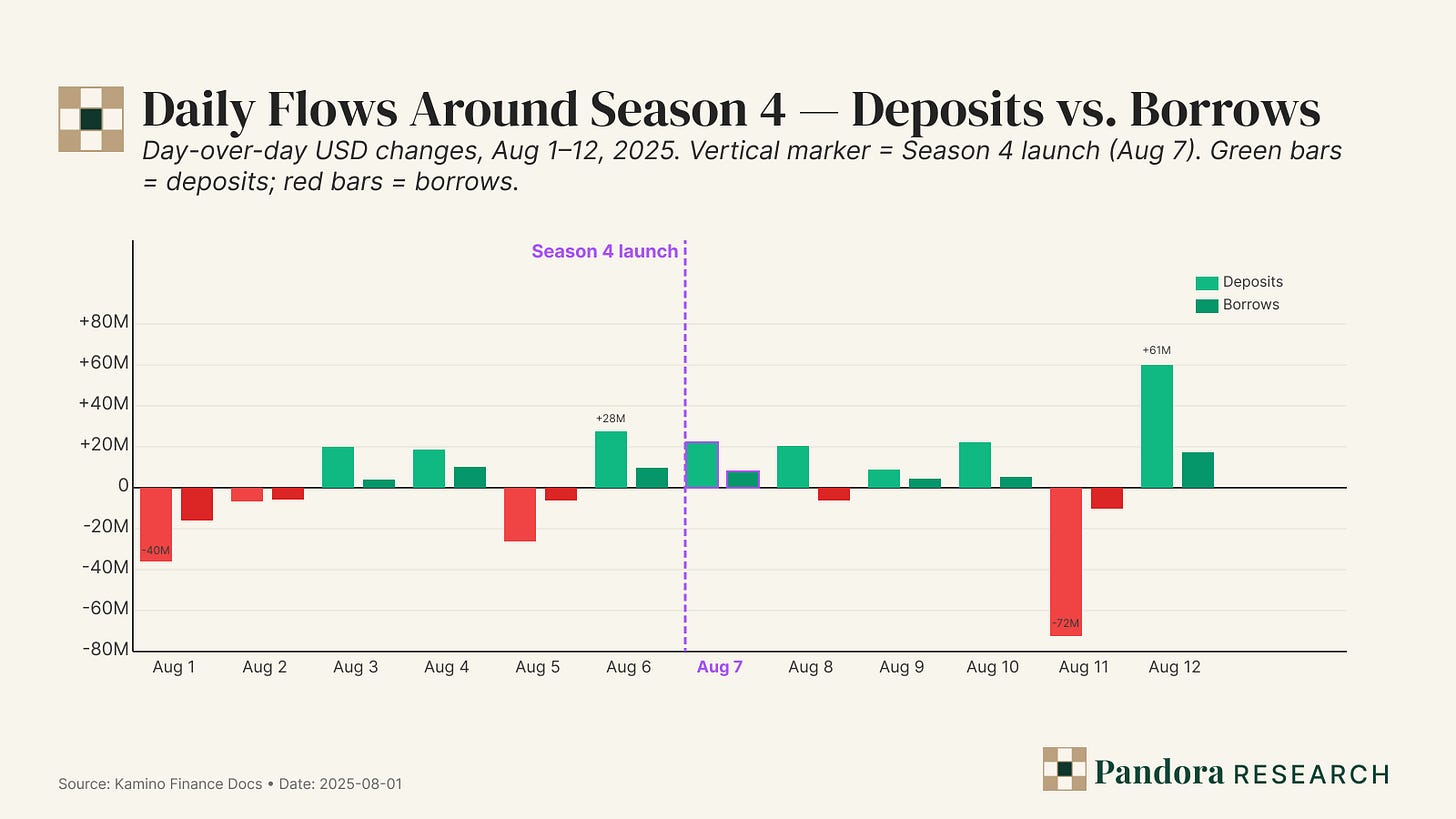
The daily bars answer a different question: what actually moved around launch? The pattern is straightforward:
- ◆Pre-launch whipsaw (Aug 1–6). We saw big outflows on Aug 1 and Aug 5, then a strong positive day on Aug 6. That’s typical pre-campaign jockeying: capital rotates to where it expects rewards to land.
- ◆Launch pop (Aug 7). Deposits and borrows both printed green, but deposits dominated. That’s textbook incentive response: supply runs before demand reorganizes.
- ◆Mixed mid-week, one big hit, then a strong rebound (Aug 8–12). Borrow bars were positive but smaller and later; Aug 11 printed the largest single-day deposit outflow; Aug 12 snapped back hard with a big deposit day and the strongest borrow day in the window.
Two conclusions you can defend with just this chart:
- ◆Flows are deposit-led so far. That’s not inherently bad—sustainable borrow requires inventory—but it raises the bar for the coming days: retention and conversion have to follow, or the deposits will roll off when the headline fades.
- ◆Borrow is reacting, not leading. The lag between deposit surges and borrow pickup is the core risk to watch. If that lag tightens over the next two weeks, the season is working; if it doesn’t, we’re subsidizing inventory rather than credit.
Token & Float — supply only matters if it hits the tape
KMNO trades around $0.058–0.06 with ~2.52B circulating and 10B max supply (mcap ~$150–153M, implied FDV ~$595M). Two near-term unlock clusters (Jul 30 and Aug 30) each released/plan to release ~229.2M KMNO (145.8M “Key Stakeholders & Advisors” + 83.3M “Core Contributors”), ~2.29% of max per event. Despite the ~$13M July unlock at prevailing prices, price held near $0.06 and mcap drifted up—i.e., no obvious unlock dump in spot. Season 4 rewards have a 6-month vest with forfeiture, so emissions are time-diluted rather than cliff-immediate.
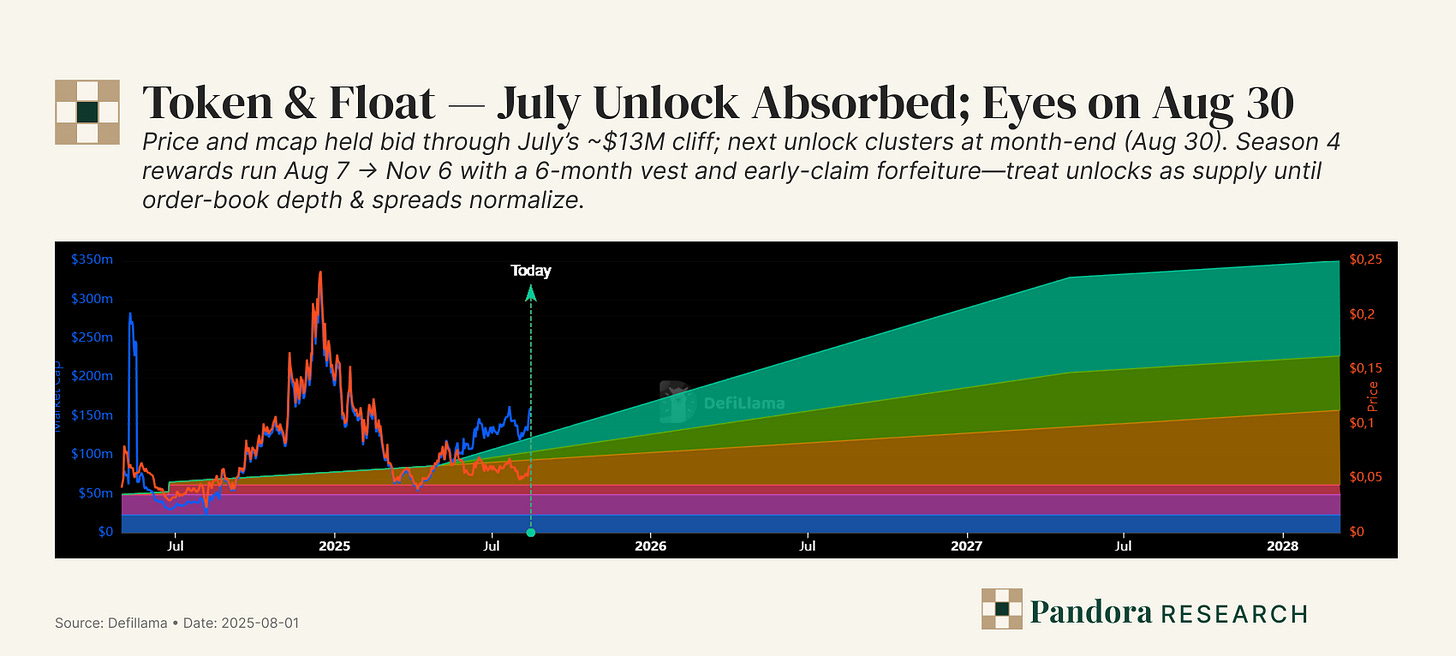
Why float didn’t bite (yet). Three forces likely absorbed July’s print:
- ◆Depth improved into the event, so the marginal seller met real bids;
- ◆Program design (vesting + geo eligibility) staggered unlock-adjacent claims;
- ◆Protocol throughput was strong into late July (fees, borrow, volume), supporting demand for exposure.
Undervaluation framing (peer-clean, no heroics).
- ◆FDV / TVL: With FDV ~$595M vs Kamino TVL ~$3.0B, KMNO sits near ~0.19×. The EVM lending cohort’s steady-state range has lived around 0.05×–0.40×, with leaders (Aave-like) clustering ~0.20×–0.30× at comparable maturity. 0.18× is low-to-mid band relative to a venue holding ~29% of chain TVL and monetizing flow (fees/TVL ~4%).
- ◆Implied rerate math: At 0.25× on today’s TVL, FDV ≈ $750M (no growth assumed). That’s ~+40% vs current implied FDV—without touching the revenue side.
- ◆Price / Sales (protocol revenue): Annualized revenue ~$19M. On mcap ($135M) that’s P/S ~7×; on FDV ($530M) it’s ~28×. EVM comps in 2024–25 commonly cleared ~30–60× P/S in expansion regimes (with big dispersion by utilization). On this lens, KMNO screens inexpensive given borrow/TVL ~58% and a clear fee base.
The float lens we actually care about.
Unlocks and rewards are supply; the question is whether they become float (tradable selling pressure). The evidence we have:
- ◆July unlock behavior: Price held ~$0.06 through the ~$13M event; no drawdown attributable to unlocks. That says holders didn’t rush the tape or depth absorbed it.
- ◆Aug 30 unlock (similar magnitude): Treat as another absorption test. If spot/DEX depth and spreads remain stable before/after, we can infer supply found homes (staking, longer-dated hands, market makers).
- ◆Season 4 vesting: The 6-month vest dampens instant sell-pressure. What matters isn’t the headline emission; it’s the claim cadence and secondary market behavior of vested tranches. Eight days in, deposits have led borrows; that’s consistent with delayed borrow conversion rather than mercenary sell flows.
Risks specific to float.
- ◆A single venue dominating KMNO liquidity—if depth migrates or thins, even modest unlock tranches can gap price.
- ◆Reward-claim cliffs—if a large cohort hits 100% vest in a tight window and program incentives rotate, synchronised selling can overwhelm books.
- ◆Corridor stumbles—if BTCFi/xStocks don’t convert to borrow, the narrative bid softens right as supply steps up.
Competitive Valuation — where Kamino screens vs peers
- ◆Monetization intensity: Kamino generates $41.3M fees per $1B TVL, top-quartile behind Euler ($67.8M) and roughly in line with Fluid ($44.7M). It materially outperforms AAVE ($25.9M) and Compound ($21.9M).
- ◆Healthy engine mix:Utilization ~61% with a 15.8% take rate puts Kamino in the upper-right of both monetization plots—credit is actually deployed and monetized without requiring outsized fee splits.
- ◆Valuation vs revenue: On the P/S map, Kamino sits in the value zone at ~8.2× Mcap / revenue, far below the peer median (~33×) and well under AAVE (~32×), Euler (~34×), Maple (~56×), Fluid (~52×), Venus (~23×), Spark (~17×), Save (~16×), and JustLend (606×).
- ◆Capacity multiple (sanity check): On FDV/TVL, Kamino is mid-pack at ~0.21×, not the cheapest (Save/JustLend ~0.06×–0.064×) and nowhere near the richest (Fluid ~0.50×). The valuation case doesn’t rely on being the lowest “capacity” multiple; it rests on higher throughput per unit of TVL priced below peers on P/S.
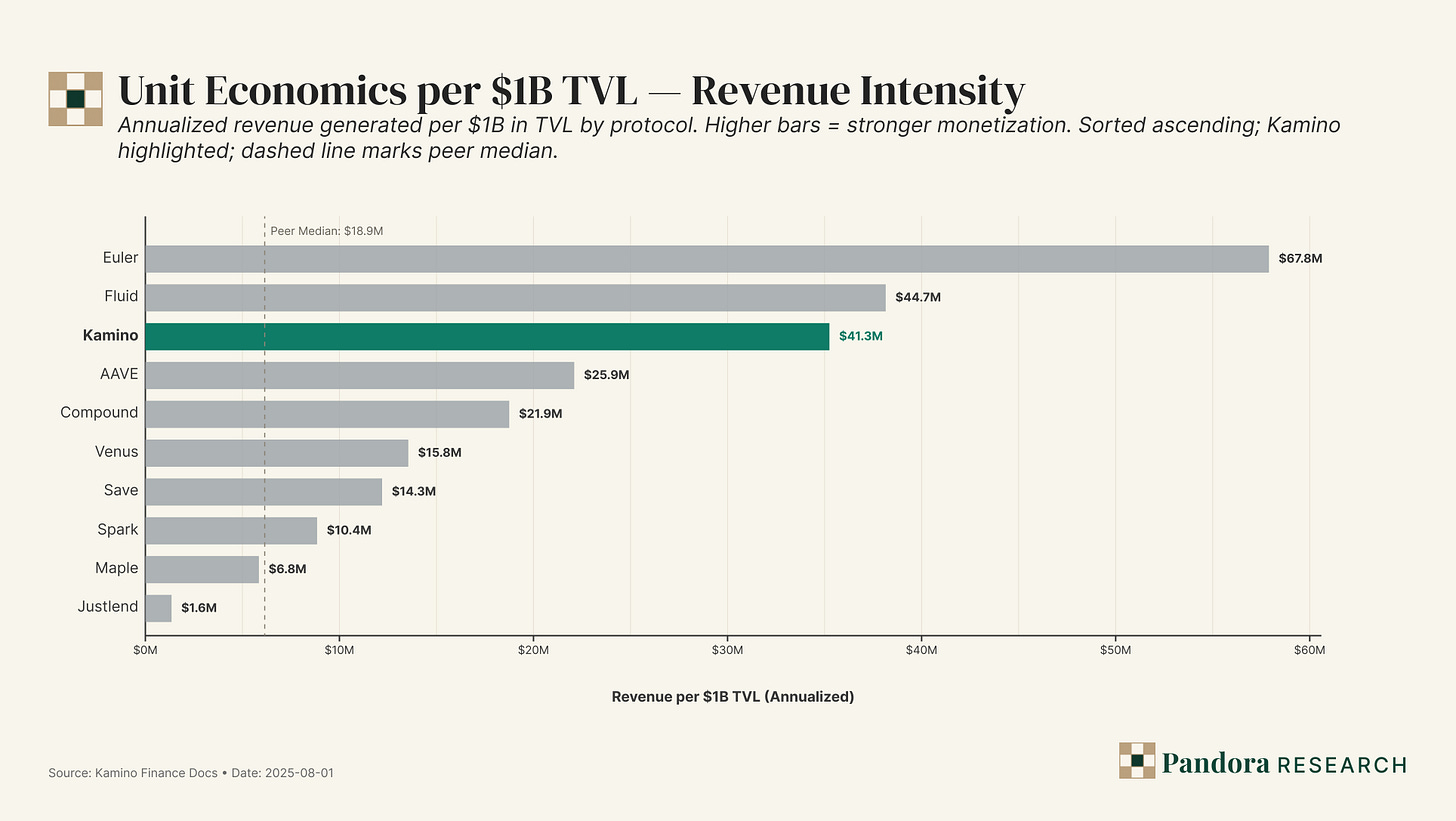
- ◆Kamino: Fees annualized $119.43M on $2.893B TVL ⇒ $41.3M per $1B.
- ◆Peers (fees per $1B): Euler $67.8M (highest), Fluid $44.7M, Kamino $41.3M, AAVE $25.9M, Compound $21.9M, Venus $15.8M, Save $14.3M, Spark $10.4M, Maple $6.8M, JustLend $1.6M.
- ◆Peer median on the slide is ~$18.9M. Kamino clears that by ~2.2×.
Interpretation. Kamino is monetizing balance-sheet usage better than the “big but idle” venues. Against the two market leaders by brand (AAVE/Compound), Kamino’s fee intensity is ~1.6×–1.9× higher. Even if we swapped Fees for Revenue, the relative ordering still favors Kamino because the take rate (next section) is not an outlier that would artificially inflate the fee line.
Caveat. Euler’s very high intensity (and >100% utilization later) reflects a smaller, active book—great for the scatter, but not necessarily reproducible at Kamino’s scale. The key is that Kamino’s intensity is already top-tier while running a multi-billion TVL book.
Monetization Curve — Take Rate vs Utilization
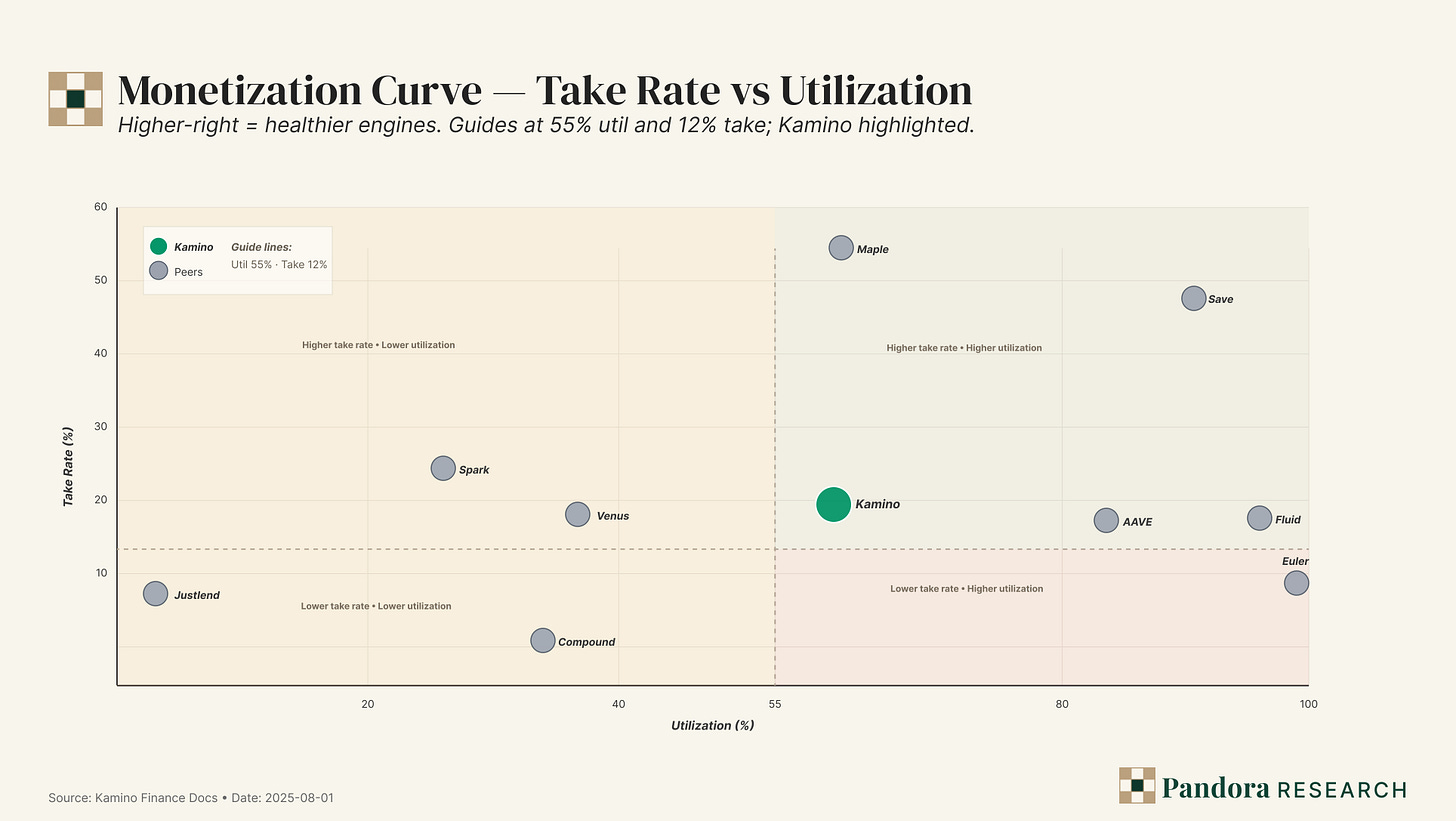
- ◆Kamino:Utilization 61.0%, take 15.8% → squarely in the healthy zone: high deployment with a normal fee split.
- ◆AAVE: 73.1% util at 14.1% take → very efficient deployment with conservative take; explains its durable franchise.
- ◆Save: 81.1% util, 27.1% take → high deployment and high take; strong monetization but the fee split is notably richer than AAVE/Kamino.
- ◆Fluid: 100.7% util, 14.3% take → aggressive deployment; take similar to Kamino/AAVE.
- ◆Euler: 108.3% util, 6.2% take → extreme deployment with a very light take; terrific intensity per TVL but margin capture is thin.
- ◆Compound/Spark/Venus: lower util (29–42%) and modest takes (3–15%); these look supply-heavy, demand-lighter.
- ◆JustLend: 4.0% util, 6.8% take → book largely idle.
Interpretation. Kamino’s mix (61% util, 15.8% take) signals quality demand rather than subsidy-driven throughput. It is not extracting outsized fees to hit the 4% fees/TVL line; instead, it combines above-median utilization with a middle-of-pack take. That’s the combination you want to scale: credit that clears at normal pricing.
Fees/TVL × Utilization (bubble = TVL)
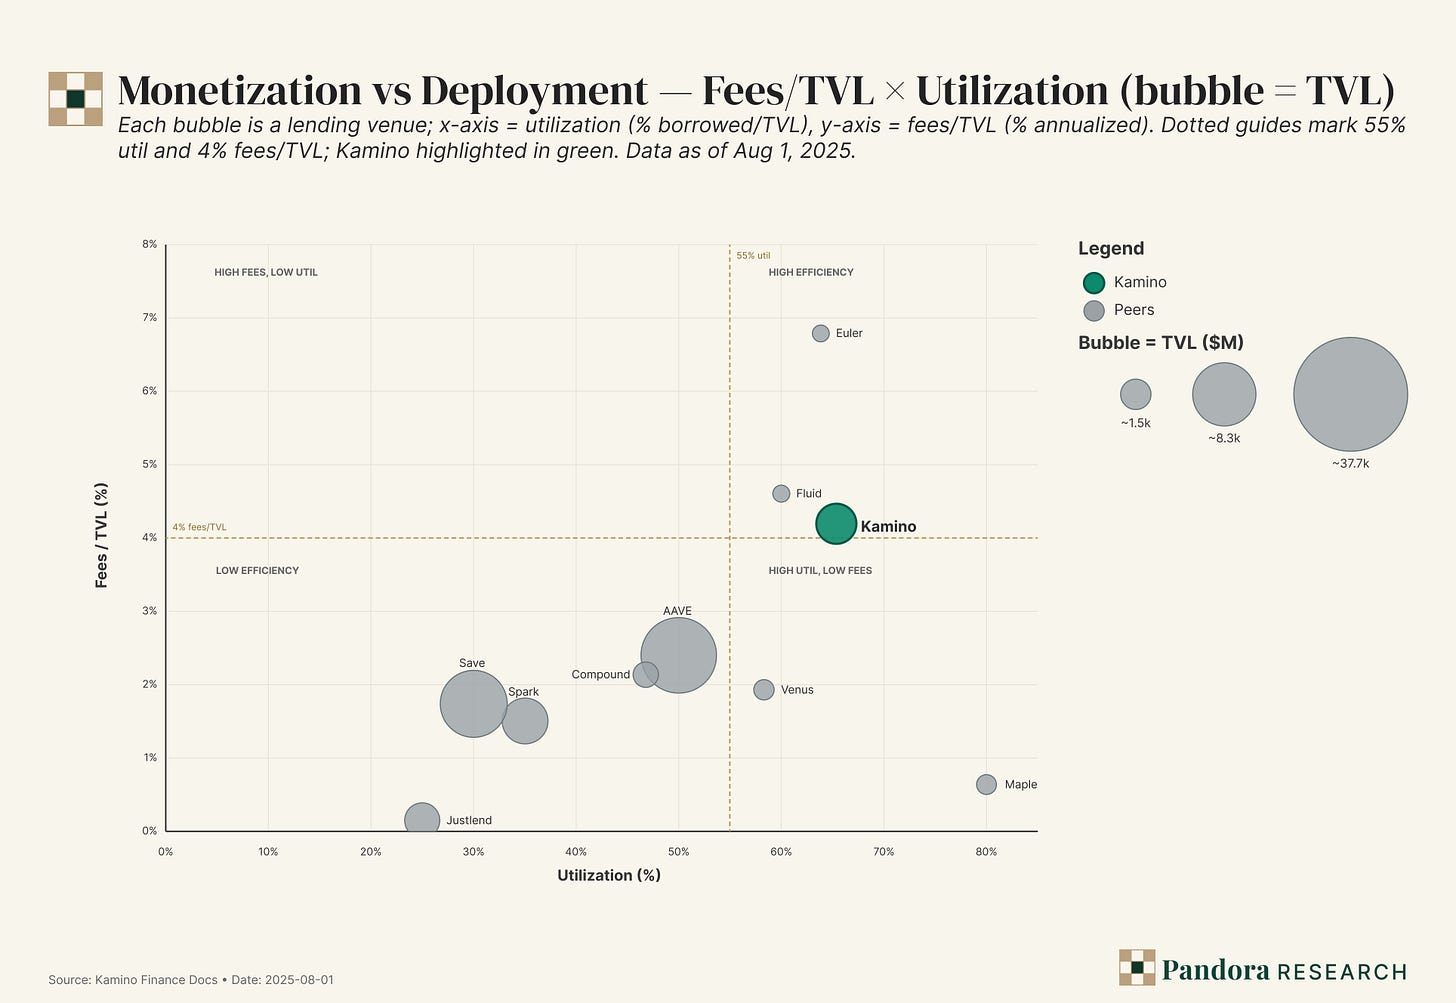
- ◆Kamino:4.13% fees/TVL and 61% util, sitting just to the upper-right of the 4% and 55% guide rails. Bubble size (TVL) is large; this isn’t a small-base trick.
- ◆AAVE: ~2.6% fees/TVL at ~50–73% util (depending on which series you emphasize)—below the 4% horizontal but with big TVL.
- ◆Fluid/Euler: above 4% fees/TVL and very high util; smaller absolute TVL than AAVE/Kamino but strong intensity.
- ◆Spark/Venus/Compound/Save: mostly left-or-below the thresholds; these look like lower-efficiency zones in aggregate.
Interpretation. This view connects the dots: Kamino hits your “three-number rule” proxies (≥4% fees/TVL, ≥55% util) while pushing multi-billion TVL. That combination is rare and should command at least peer multiples on revenue—yet it doesn’t (next section).
Revenue vs Valuation (P/S bands)
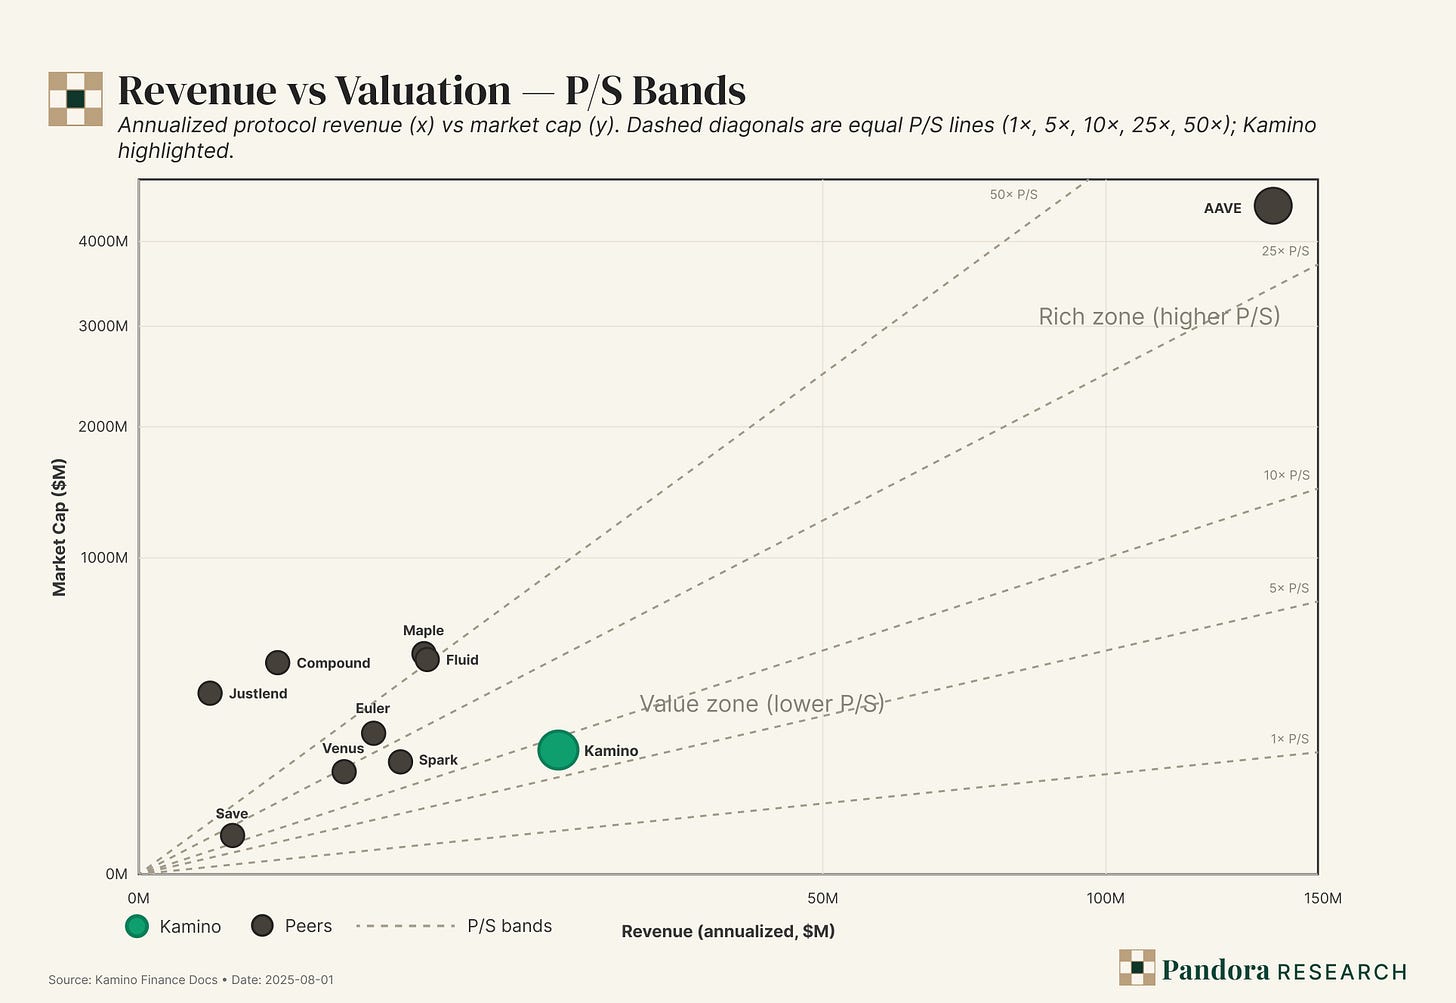
X = revenue annualized; Y = Mcap. Dashed diagonals are equal P/S lines.
- ◆Kamino:$18.83M rev annualized vs $153.5M mcap ⇒ P/S ≈ 8.15×.
- ◆Peers (P/S mcap): AAVE 32.4×, Euler 34.0×, Maple 55.9×, Fluid 52.1×, Venus 23.2×, Spark 17.2×, Save 16.1×, Compound 217.8×, JustLend 606.9×.
- ◆Peer median (10 names, excl. MarginFi null) ≈ 33×.
Interpretation. At ~8×, Kamino’s equity is priced like a middling revenue engine, not like a venue that is top-quartile on fee intensity and clears the 4%/55% gates. Among large-cap peers, only AAVE has the same “healthy engine” look, yet its P/S is ~4× Kamino. If Kamino simply rerates to the peer median on current revenue, the implied mcap multiple is ~4× higher than today’s 8×—and that ignores any growth or mix shift.
Why isn’t FDV/TVL enough? Because capacity (TVL) without throughput (fees/revenue) can look cheap while being unproductive. Kamino’s FDV/TVL ~0.21× is mid-pack; its P/S ~8× is cheap versus peers that monetize less per dollar of TVL yet trade at higher P/S.
Relative Value: FDV per $1 of TVL (sorted)
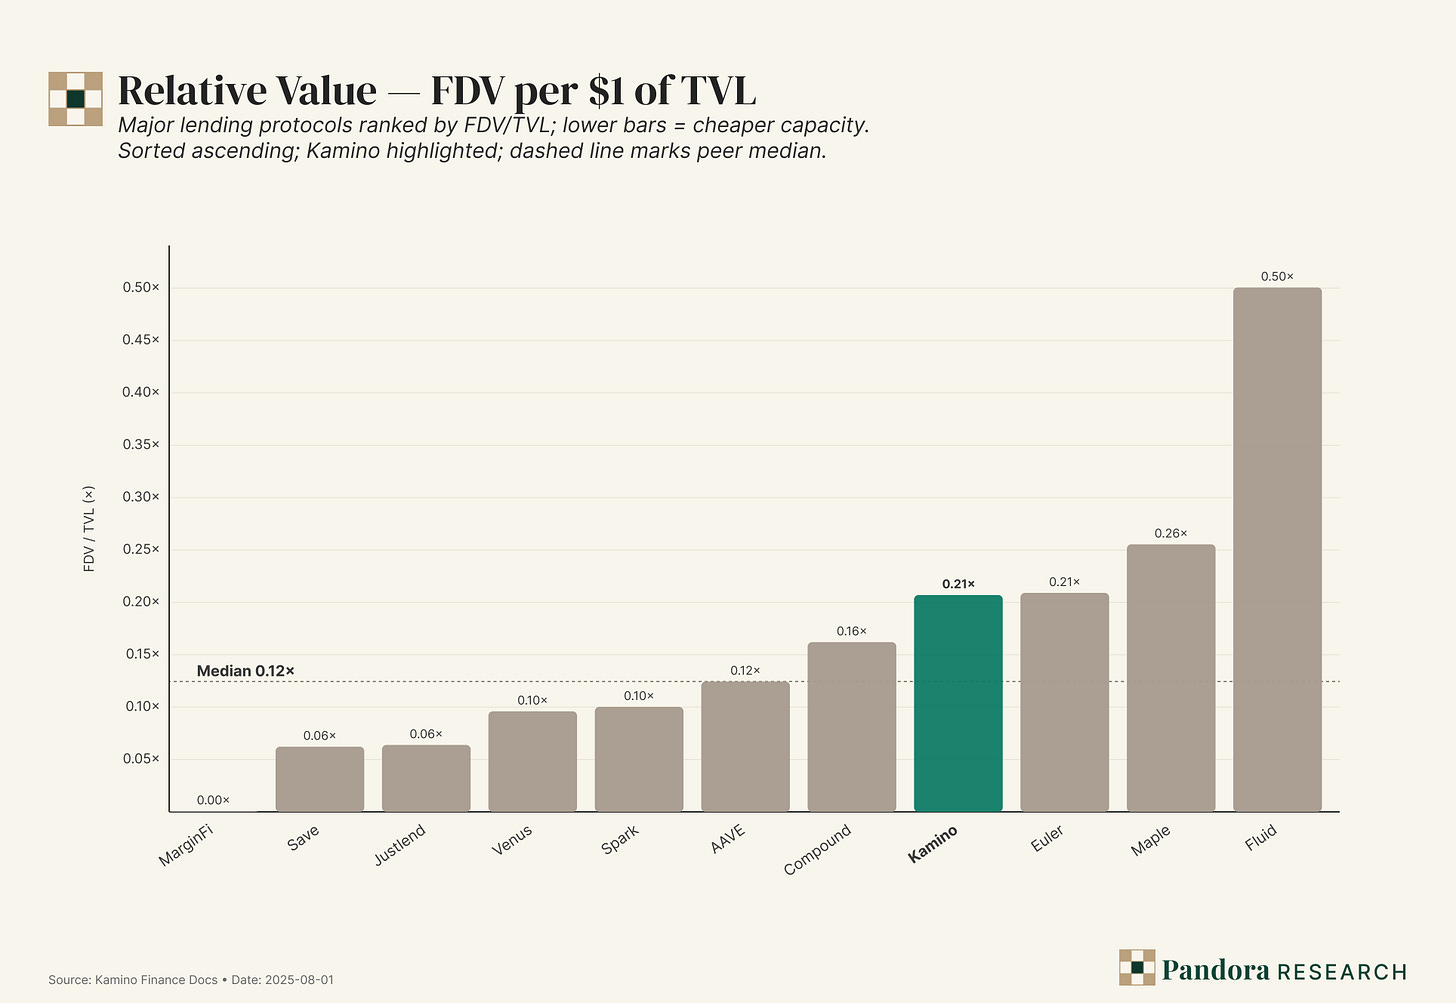
On a pure “capacity pricing” yardstick, Kamino sits mid-pack at ~0.21× FDV/TVL against a peer median ≈0.12×. That’s well below the premium cohort (Maple 0.26×, Fluid 0.50×) and roughly in line with Euler (0.21×), while ahead of low-multiple venues like Save (0.06×), JustLend (0.06×), Spark (0.10×), Venus (0.10×), and Aave (0.12×).
Two points matter:
- ◆Capacity vs. throughput. Kamino’s price per $1 of TVL is not expensive relative to peers that monetize less per TVL; yet in our Unit Economics per $1B TVL chart, Kamino delivers ~$41.3M annualized revenue per $1B—top-tier alongside Euler/Fluid. Mid-pack capacity multiple with top-tier revenue intensity is the mispricing.
- ◆Consistency with P/S view. The P/S scatter showed Kamino clustering in the “value zone” (lower P/S for its revenue). FDV/TVL confirms the same on a different axis: markets paying 0.26–0.50× FDV/TVL (Maple/Fluid) are implicitly valuing capacity more richly than Kamino despite similar or weaker monetization per TVL.
Takeaway. Across three lenses—P/S bands, revenue per $1B TVL, and FDV/TVL—Kamino screens as efficient throughput priced at only a mid-pack capacity multiple. If current fee intensity (4.1% fees/TVL) and utilization (61%) persist, the spread to the premium cohort (0.26–0.50×) is the upside lever.
Where the numbers could be wrong (and how to watch them)
- ◆Cross-chain mix. AAVE/Compound run multi-chain books; Maple/Euler carry idiosyncratic risk structures; Tron’s JustLend has distorted P/S because revenue is tiny relative to mcap. The conclusion should be robust to these outliers because we’re using four independent lenses, not one.
- ◆Windows. Fees/TVL and revenue are annualized off recent prints. If Season-style incentives distort pricing/volumes, the annualization may overstate true run-rate—hence your own retention gate is crucial (7/14/30-day checks).
- ◆Utilization >100%. Euler/Fluid show >100% util in the dataset, likely methodology/aggregation quirks; the relative ordering still helps for positioning, but treat absolute values with a grain of salt.
Where Kamino is clearly ahead—and where it isn’t
- ◆Ahead
- ◆Fees per TVL: $41.3M per $1B vs AAVE $25.9M / Compound $21.9M.
- ◆Engine mix: 61% util with a mid-teens take; it monetizes without over-extracting.
- ◆P/S: ~8× vs median ~33×; the largest gap among major, functioning venues.
- ◆Not ahead
- ◆Capacity multiple: FDV/TVL at ~0.21× is middle of the pack, so the “cheap capacity” narrative alone doesn’t carry the day.
- ◆Revenue absolute scale: AAVE/Spark/Maple/Fluid plot farther to the right on revenue (size), though Kamino’s multiple is lower than theirs almost across the board.
Kamino’s operating profile is where you want a lender to live—≥4% fees/TVL and ≥55% utilization—and it earns $41M of fees per $1B of TVL while being valued at ~8× P/S, a deep discount to peers that monetize less per unit of TVL. FDV/TVL says Kamino is not the cheapest capacity; the throughput-per-capacity lens says it’s mis-priced vs revenue. Keep the case anchored to these four diagnostics; if the points drift left/down or below the guide rails, the relative-value argument evaporates.
Risk map
- ◆Deposits and borrows fail to retain ~60% at 30 days after campaigns, implying churny, subsidy-driven flow.
- ◆Kamino’s share of Solana DeFi TVL slips below ~25% for a sustained stretch as rivals recapture liquidity.
- ◆Borrowed/TVL trends under ~50–55% for weeks, pointing to idle balance sheets rather than real credit demand.
- ◆Fees/TVL drifts toward ~3% (from ~4%) without an offsetting change in mix, suggesting weaker pricing or thinner depth.
- ◆Liquidation count/notional spikes versus corridor norms, hinting at unsafe LTVs or fragile spot/liquidity.
Bottom line
Kamino behaves like Solana’s credit router. While share ≥25%, borrowed/TVL ≥55%, and fees/TVL ~4% hold, we stay long KMNO and size around catalysts. If any of those break on a sustained basis—or if retention and oracle/RWA plumbing wobble—we step aside. Bet the throughput, not the TVL headline.
Sources & further reading
- ◆DefiLlama — Kamino protocol page (TVL, fees, revenue): https://defillama.com/protocol/kamino
- ◆DefiLlama — Solana chain dashboard: https://defillama.com/chain/solana
- ◆DefiLlama — Fees & revenue (Kamino): https://defillama.com/protocol/fees/kamino
- ◆Kamino Governance — Monthly Risk Insights (July 2025): https://gov.kamino.finance/t/kamino-lend-monthly-risk-insights-july-2025/818
- ◆Kamino Governance — xStocks integration note: https://gov.kamino.finance/t/kamino-is-integrating-xstocks-powered-by-the-chainlink-data-standard-to-enable-tokenized-equities-lending/792
- ◆Kamino Blog/Docs — Token info & vesting: https://docs.kamino.finance/kmno/token-info
- ◆CoinMarketCap — KMNO price & cap: https://coinmarketcap.com/currencies/kamino-finance/
- ◆Pyth — Solana feeds: https://docs.pyth.network/price-feeds/sponsored-feeds/solana
- ◆Chainlink — Data feeds overview: https://docs.chain.link/data-feeds/price-feeds
- ◆Switchboard — Product docs: https://docs.switchboard.xyz/product-documentation/data-feeds
- ◆Table — Kamino Finance by Pandora Research: https://docs.google.com/spreadsheets/d/1Xra3DCjdLfuVJdx82i7l8HZvVuigsLnakjovKJUJHxw/edit?gid=0#gid=0
Disclaimer
The views and information presented here are offered by me in an individual capacity and do not represent any firm, fund, or other organization. All content is provided “as is,” with no warranties—express or implied—regarding accuracy, completeness, timeliness, or fitness for any purpose. Nothing in this material constitutes—or should be interpreted as—financial, legal, tax, or investment advice, nor does anything herein constitute a solicitation, offer, or recommendation to buy, sell, or hold any security, digital asset, or other instrument.
You alone are responsible for evaluating the merits and risks associated with any action you take based on the information provided. I accept no liability for any loss, damage, or harm—direct or consequential—that may arise from reliance on this content or from any investment decisions you make. Information is impersonal, not tailored to your circumstances, and may become outdated without notice.
By reading or otherwise using this material, you acknowledge and agree to these terms
Affiliate Disclosures
- •The author and/or others the author advises do not currently hold, or plan to initiate, an investment position in target.
- •The author does not hold an affiliated position with the target such as employment, directorship, or consultancy.
- •The author is not being compensated in any form by target in relation to this research.
- •To the best of the author's knowledge, the information provided here contains no material, non-public information. The accuracy of the information is the responsibility of the reader.
5
0